The “Pregnant” Market and Rare Stars: 5 Surprising Signals From Today’s BIST 30 Analysis
1. The Hook: Navigating the Noise of the BIST 30
The Turkish market is currently a landscape of stark contradictions, where surface-level momentum masks a deeper struggle for direction. On one hand, investors are witnessing outlier performances like DSTKF’s staggering 72.86% run since late January. On the other, the underlying “candlestick” patterns are whispering a more cautious narrative. While the index shows signs of resilience, the technical data suggests a significant shift in sentiment is brewing beneath the surface. Are you prepared to decode these signals, or are you simply riding the noise toward a potential reversal?
2. Takeaway 1: Why the Market is Suddenly “Pregnant” (The Rise of the Harami)
The BIST 30 is currently defined by the “Harami,” a pattern signaling that a trend’s momentum is being contained by a new period of indecision.
“The term ‘Harami’ is derived from an old Japanese word meaning ‘pregnant.’ In this analogy, the black candlestick represents ‘the mother,’ and the small candlestick represents ‘the baby.'”
However, these “pregnancies” are birthing two very different outcomes. On one side, we see a cluster of Bullish Harami patterns (XU030, EREGL, GUBRF) suggesting a potential resurgence. The standout here is AKBNK, where the pattern has moved from potential to a confirmed BUY signal. As the system notes, “Let’s jump on our white horses and go for a bullish ride,” marking a rare moment of pure bullish fervor in the banking sector.
Conversely, the Bearish Harami is showing its teeth in the transportation sector. In PGSUS, the “mother” trend has officially birthed a downward correction, leading to a confirmed SELL signal.
3. Takeaway 2: The Great Cashing Out—Blue Chips Hit the “SELL” Wall
We are witnessing a “Great Cashing Out” as several market leaders hit a technical wall. The psychological shift from “bullish fervor” to a coordinated bearish alignment is no longer a theory—it is being triggered by aggressive reversal patterns across major sectors.
Top 3 Confirmed SELL Signals (Gains since last BUY):
- KCHOL (Koc Holding): +21.49% (Pattern: Bearish Evening Star)
- SISE (Sise Cam): +18.80% (Pattern: Bearish Kicking)
- PGSUS (Pegasus): +10.18% (Pattern: Bearish Harami)
These exits represent institutional distribution. KCHOL’s “Bearish Evening Star” is a classic three-day reversal indicating a top, while SISE’s “Bearish Kicking” suggests a violent shift in sentiment evidenced by a downward price gap. For these giants, the “SELL” wall is firm.
4. Takeaway 3: When Failure is a Feature, Not a Bug (The Stop-Loss Lesson)
Technical analysis is a game of probabilities, not certainties, and the recent ASELS case study highlights why capital preservation must always trump profit-chasing. The system recently issued a SELL signal for ASELS that failed to materialize; the market’s bullish enthusiasm simply overrode the pattern.
“Sometimes, even reliable candlestick patterns can falter. We owe you an apology for that, but this is exactly why we have the stop-loss mechanism.”
The “Bullish Stop-Loss” was triggered for ASELS today, preventing further error. This discipline is the “feature” of the system. We saw the inverse benefit in PETKM, where strict confirmation rules successfully identified a “bull trap.” By demanding a high bar for confirmation, the system kept capital safe on the sidelines rather than chasing a false rally.
5. Takeaway 4: A Rare Warning—The Appearance of the “Tri Star”
In the world of technical analysis, some signals are common, but the KRDMD (Kardemir D) entry has produced something “highly noteworthy” and extremely rare: the Bearish Tri Star. This pattern consists of three consecutive Dojis—three days where the market opened and closed at the same price.
It is as if the market is holding its breath. This three-day stalemate between bulls and bears is an extraordinary signal of exhaustion. While the system technically suggests a “STAY LONG” for now, it warns that the “likelihood of a downside breakout is significant.” When the market reaches this level of equilibrium after an uptrend, the subsequent move is often a sharp break to the downside.
6. Takeaway 5: The 72% Shooting Star (Extreme Gains vs. Extreme Warnings)
The most dramatic narrative in the BIST 30 belongs to DSTKF (Destek Finans Faktoring), which has climbed +72.86% since January 21. However, at the peak of this mountain, a Bearish Shooting Star has emerged.
It is vital not to confuse this with its visual twin, the Bullish Inverted Hammer. While they look identical—a small body with a long upper wick—the distinction is found in the trend.
- Inverted Hammer: Appears at the bottom of a downtrend (bullish reversal).
- Shooting Star: Appears at the top of an uptrend (bearish reversal).
“The Shooting Star appears during an uptrend and signals a bearish reversal.”
In a stock that has surged over 70%, this shadow indicates that while bulls tried to push higher, they were met with a wall of selling. Ignoring this signal during a massive rally is the primary way traders turn legendary gains into “what if” stories.
Conclusion: The “White Horse” or the Sidelines?
Today’s market is a tale of diverging paths. We see flickers of a bullish resurgence in ISCTR (Bullish Homing Pigeon) and TOASO (Bullish Matching Low), but these are set against a backdrop of a unified exit in the transportation sector, with PGSUS, THYAO, and TAVHL all flashing confirmed SELL signals.
Because of this sectoral fragmentation, the “Delayed Intraday Module” has become an indispensable tool. Real-time price action is now the only way to distinguish between a minor dip and the start of a deep correction.
In a market flashing both “pregnant” warnings and rare “tri stars,” are you prepared to ride the AKBNK white horse of momentum, or is it time to seek the strategic comfort of the sidelines?
Market Analysis and Strategic Signal Briefing: BIST 30 Securities
Executive Summary
As of February 18, 2026, the Turkish market, represented by the BIST 30 Index (XU030), is exhibiting a period of transition characterized by emerging bullish signs despite several individual securities hitting potential market tops. The overall index recommendation remains STAY IN CASH, but a Bullish Harami pattern suggests a high probability of a shift to a BUY signal.
The current landscape is marked by a significant wave of profit-taking recommendations, with seven major securities (including KCHOL, THYAO, and SISE) triggering new SELL signals following the confirmation of bearish reversal patterns. Conversely, AKBNK has emerged as the sole new BUY signal. High-performing long positions such as DSTKF (+72.86%) and TTKOM (+22.99%) continue to be advised as STAY LONG, though increasing bearish patterns across the portfolio necessitate the use of strict stop-loss levels and intraday monitoring.
——————————————————————————–
Market Sentiment and Index Performance
XU030 (BIST 30 Index)
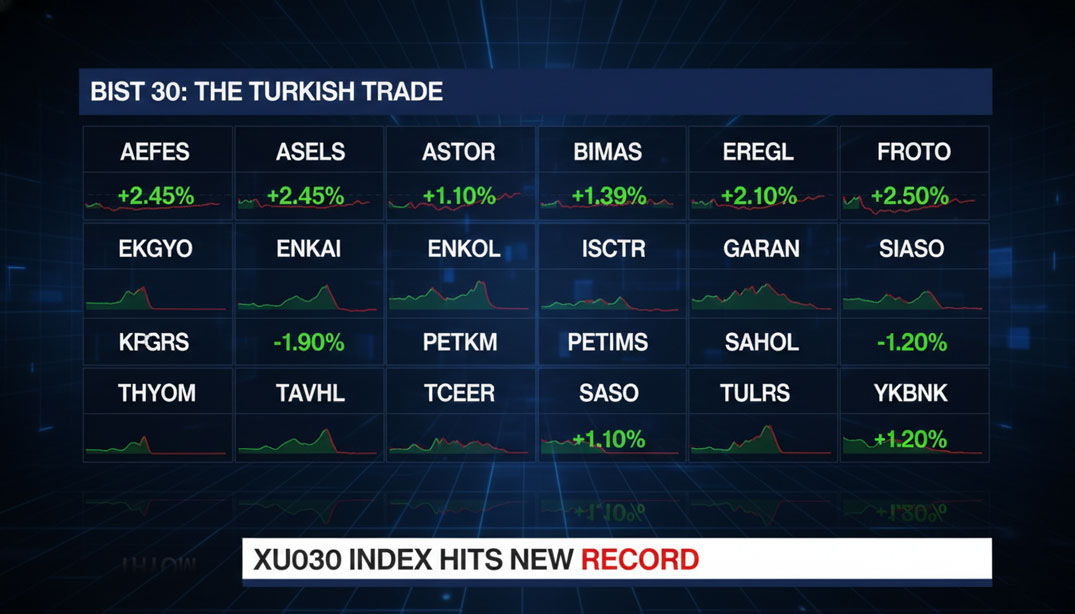
- Current Status: +0.58% Daily Return | Price: 15706
- Signal: STAY IN CASH
- Outlook: The market is showing signs of a “bullish resurgence” following a Bullish Harami pattern. While the system currently advises cash, a bullish confirmation is highly likely. Investors are encouraged to use the Delayed Intraday Module to monitor movements for the initial phase of a potential bull run.
——————————————————————————–
Strategic Action Signals
New BUY Recommendations
The following security has moved from a bearish or neutral stance to an active buy signal based on pattern confirmation.
| Ticker | Company | Pattern | Confirmation Level | Current Price |
| AKBNK | Akbank | Bullish Harami | 89.90 | 90.50 |
- Insight: Prices crossed above the confirmation level, ending a previous sell cycle that saw a minor decline of -0.04%. The trend is now officially considered bullish.
New SELL Recommendations
Seven securities have triggered SELL signals today. The common theme across these stocks is a loss of momentum and the formation of top reversal patterns.
| Ticker | Company | Pattern | Performance Since BUY |
| KCHOL | Koç Holding | Bearish Evening Star | +21.49% |
| SISE | Şişe Cam | Bearish Kicking | +18.80% |
| PGSUS | Pegasus | Bearish Harami | +10.18% |
| TAVHL | Tav Havalimanları | Bearish Engulfing | +9.66% |
| MGROS | Migros Ticaret | Bearish Engulfing | +7.69% |
| ENKAI | Enka İnşaat | Bearish Engulfing | +1.75% |
| THYAO | Türk Hava Yolları | Bearish Harami Cross | +0.17% |
- Insight: Traders are advised to close long positions as these securities appear to be at a market top or the beginning of a correction.
——————————————————————————–
Portfolio Maintenance: Holding and Cash Positions
High-Performing STAY LONG Positions
The system recommends maintaining current long positions for the following securities, despite the presence of some bearish patterns that have not yet reached confirmation levels.
- DSTKF (Destek Finans Faktoring): +72.86% since Jan 21. Bullish control remains strong; bearish Shooting Star failed to confirm.
- TTKOM (Türk Telekom): +22.99% since Jan 13. System maintains STAY LONG despite a Bearish One Black Crow pattern.
- AEFES (Anadolu Efes): +20.79% since Jan 23. Bearish Engulfing present but confirmation is unlikely due to price distance.
- YKBNK (Yapı ve Kredi Bankası): +10.43% since Feb 9. Bullish sentiment remains dominant.
- BIMAS (BİM Mağazalar): +10.82% since Jan 28. Vigilance Required: Bearish Engulfing detected; confirmation chance is high.
STAY IN CASH / Neutral Positions
Several securities are currently sidelined due to the lack of bullish confirmation or the triggering of stop-losses.
- Stop-Loss Triggers: ASELS and PETKM triggered Bullish Stop-Losses today. In ASELS, the previous sell signal failed, but the system remains in cash pending a white body close above stop-loss levels.
- Bearish Dominance: FROTO, SAHOL, TCELL, and TRALT remain in cash as bears continue to dominate or challenge market supremacy without clear entry patterns.
- Bullish Potential: EREGL, GUBRF, ISCTR, and TOASO have detected bullish patterns (Harami, Homing Pigeon, or Matching Low) and are awaiting confirmation to move to a BUY signal.
——————————————————————————–
Technical Pattern Analysis
The current market phase is defined by the following Japanese Candlestick patterns identified in the source data:
Reversal Patterns (Bearish)
- Bearish Engulfing: A large black body completely engulfs the preceding small white body. Found in AEFES, BIMAS, ENKAI, GARAN, MGROS, and TAVHL.
- Bearish Harami / Harami Cross: A small black body (or Doji in the Cross version) contained within a large white “mother” body. Noted in PGSUS and THYAO.
- Bearish Evening Star: A three-day top reversal pattern (White candle, Star, Black candle). Confirmed in KCHOL.
- Bearish Kicking: A white Marubozu followed by a black Marubozu with a gap. Confirmed in SISE.
- Bearish One Black Crow: A black candle following a white candle in an uptrend, closing lower but not engulfed. Noted in SASA and TTKOM.
Reversal Patterns (Bullish)
- Bullish Harami: A small white body within a large black body. Identified in XU030, AKBNK, EREGL, and GUBRF.
- Bullish Homing Pigeon: Similar to Harami, but both candlesticks are black. Identified in ISCTR.
- Bullish Matching Low: Two black candlesticks with equal closes during a downtrend, suggesting a strong support level. Identified in TOASO.
System-Specific Patterns
- Bullish Stop-Loss: Activated by two consecutive highs or a close above the stop-loss level of a recently confirmed bearish pattern. This mechanism is designed to minimize losses when a sell signal fails to materialize into a downtrend.
——————————————————————————–
Risk Mitigation Summary
The system emphasizes the use of the Delayed Intraday Module. When this module is ON (as it is for XU030, ASELS, BIMAS, EKGYO, KRDMD, and others), it is essential to monitor price action during the trading day to manage risks or capture early-stage bullish runs. When the module is OFF, the system suggests following the primary signal without immediate intraday intervention.